Notes
In the short run, the market is a voting machine but in the long run it is a weighing machine. – Warren Buffett. This means fools will often have bad companies go high on the market on shorter runs but eventually the companies that have true value will rise later.
Price is what you pay, value is what you get. – Warren Buffett. The value of a company at a given time is fixed, the price for the stocks can either be high or low. No matter what price you pay for stock, it’s the same value you get.
If you buy $1 worth of growing business in less than $1, you will make money in the long run.
Value of a company
If company has to rely on operations alone to grow and pay its bills, it’s the intrinsic value of the company. The critical investment factor is determining the intrinsic value of a business and paying a fair or bargain price. – Warren Buffett
Value = Shareholder equity + Discounted value of cash that can be taken out
Shareholder Equity is a company’s net worth. It is essentially the sum of money investors would be entitled to if the company stopped operations, sold off all of its assets, paid off its debts, and distributed cash to owners. Shareholder Equity is easily found on any balance sheet of any company.
Intrinsic value can be defined simply: It is the discounted value of the cash that can be taken out of a business during its remaining life.
The owner earnings calculation tells us whether or not our business could survive, and thrive, on its operations alone, or if it constantly needs to find alternative sources of cash (selling stock, taking on debt, etc) to grow.
Reported Earnings (the earnings Wall Street adores) plus Non-Cash Charges (tax write-offs that did not actually require cash) minus Capital Expenditures (the cash the business must spend to keep product pumping off the assembly line, so to speak).
Why, then, are “cash flow” numbers so popular today? In answer, we confess our cynicism: we believe these numbers are frequently used by marketers of businesses and securities in attempts to justify the unjustifiable (and thereby to sell what should be the unsalable)…though dentists correctly claim that if you ignore your teeth they’ll go away, the same is not true for [capital expenditures]. – Warren Buffett For that use J&J evaluation.
What are you willing to pay today to end up with $50 next year? Would you pay $50? $45? $20? Your answer to that is the basis for the next step in valuing a business.
Value The total value of something is what someone is willing to pay for it minus all the effort you have done to obtain it. If the effort alone costs you more than what money someone is willing to pay for it, then it has negative value.
Stock Valuation Concepts
Stock Valuation = Past and current numbers + Future Narrative
- Stock Valuation is an art. You can have the same resources but the overall output that can come with similar resources is qualitative side of stock valuation.
- Stock Valuation is a range not an absolute. Possible upside and downside of the company can be valuated using different scenarios.
- Benjamin Graham’s Formula:
\begin{equation}V *=E P S \times(8.5+2 g)\end{equation}
Share Evaluation Metrics
Return on Investment
- Money company has made or lost on an investment.
- You buy something for $10 and sold it later for $20, it’s 100% ROI.
- It’s the returns that you get from investment divided by your cost of investment.
Free Cash Flow
- Cash produced by the company minus it’s expenditures.
- Capital left after company pays for operating expenses and capital expenditures.
- Shows if company is able to run smoothly and also to pay dividends to shareholders.
- Company can have increasing FCF either due to reduced operating costs or more sales growth.
Return on Equity
- Measures a corporation’s profitability.
- Profit divided by amount of equity or total amount of money invested in the company.
- Higher ROE means company is more efficient and are able to make more money with less investment.
Price to Earnings ratio
- Know whether the stock is undervalued or overvalued.
- High P/E ratio means stock’s price is expensive related to it’s earnings and thus overvalued.
- By finding stocks with less P/E values, for same level of financial performance you get more stocks.
- The only downside is that it uses past earnings as a measure for prediction of future returns which might not always be the case. Also it doesn’t take into account the growth of the earnings.
- Important for comparing companies within the same industry.
Price to Book ratio
- Ratio of net values [ Assets - Liabilities ] to it’s market capitalization.
- Also the ratio of stock’s share price to the book value per share (BVPS).
- Market price is price investors are willing to pay for the company’s stock while book value is a conservative measure derived from company’s net value.
- P/B ratio of 0.95, 1 or 1.1 means the stock is nearly at book value. So, it is useful when the number differs from 1.
- A ratio of 0.5 would mean the stock price is at 50% of company’s book value: so good opportunity for investment.
Debt to Equity ratio
- To know how a company finances it’s assets.
- A low debt-to-equity ratio means the company uses a lower amount of debt for financing versus shareholder equity.
- Too much debt can pose a risk to company if they don’t have enough cash flow to meet their obligations.
- A high D/E doesn’t mean a company is run poorly. It varies with industry type.
- Some industries with a lot of fixed assets, such as the auto and construction industries, typically have higher ratios than companies in other industries.
Price Earnings to Growth Ratio
- Modified version of P/E to take growth into account.
- P/E ratio divided by earnings growth.
- PEG < 1 means stock’s undervalued since price is low compared to company’s expected earnings growth.
Payout ratio
- Can be an important metric if there’s a question about the dividend’s truth.
- Annual dividend rate divided by earnings.
- Closer a payout ratio is to 100% or higher, the less stable the future dividend could be.
- Payout ratios of 60% or less with a history of increasing the dividend can be seen as good metrics to judge a company.
Earnings Per Share
- Take the profit, subtract the dividends and divide by the number of shares.
- Without expenses, this information doesn’t clarify the whole picture.
Compound Annual Growth Rate
- Measures annual growth rate of an investment.
- Rather than year to year, it’s generally useful to take average over time to time rather than year by year.
Beta
- Measurement of how reactive a stock is compared to overall market.
- Beta of 1 means in line with the market.
- Less than 1 means less reactive to market swings.
Earnings Yield
- Earnings Yield = Net Profit / Market Cap or P/E upside down
- Good way to compare to treasury or bond yields to determine the attractiveness of the investment.
Pitroski F-score
- In 2008, S&P was nearly down by 40%.
- Pitroski noticed when reviewing stocks with very low price-to-book value that many of them were in poor financial shape, unlikely to survive and deserving of their low valuation. Piotroski set out to devise a system to take these low price-to-book stock lists and mechanically filter out the ones that were unlikely to survive and prosper, leaving a number of potentially attractive investment opportunities.
- Nine different criterias for judging company’s performance between past 2
years. Stock gets ‘1’ for each criteria passed and ‘0’ for if it does not. If
both years show identical value, ‘0.5’ is given. All scores are then added up.
Scores greater than 8 are worthy of consideration.
- Net Income: ‘1’ if positive
- Operating Cash Flow: ‘1’ if last year’s operating cash flow number is positive.
- Returns on Assets Increasing: ‘1’ if last year’s ROA is greater than prior year.
- Quality of Earnings: ‘1’ if operating cash flow > Income.
- Long term debt vs Assets: ‘1’ if long term debt to assets ratio is lower than year ago number.
- Current ratio: ‘1’ if short term assets/ short term liabilities ratio greater than previous year.
- Shares Outstanding: ‘1’ if outstanding shares is lower or same as prior year.
- Gross Margin: ‘1’ if gross margin from last year exceeds previous year.
- Asset Turnover: ‘1’ if rise in revenues exceeds rise in total assets.
- Tests #5 and #6 are good financial health measures, a problem with some MFI stocks. Tests #2 and #7 can red flag potential accounting oddities, and some of the others are measures of business momentum.
Cheatsheet
ID: 544ef5c7-e8ee-4ba7-9457-11c150e0569d
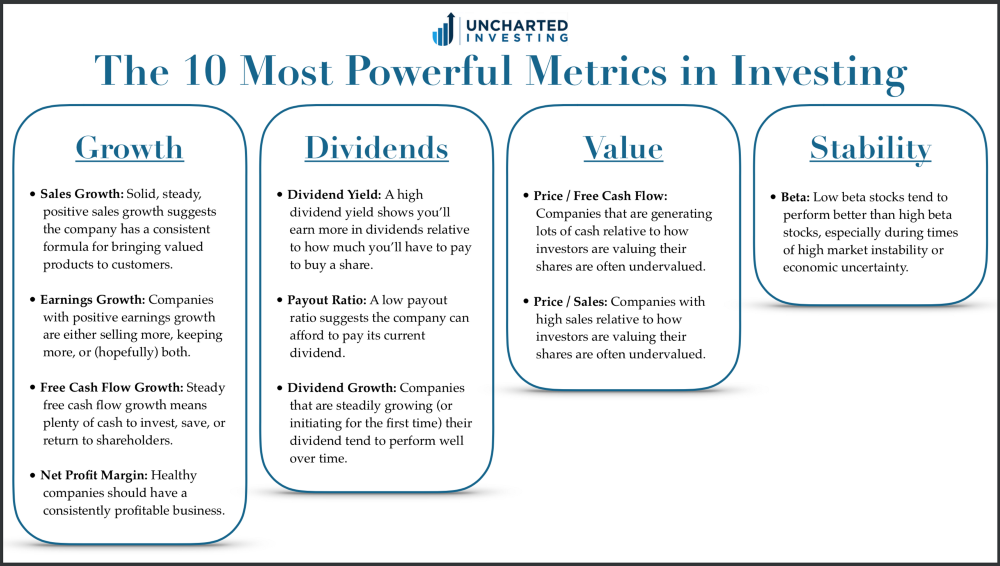
References:
- https://seekingalpha.com/article/141340-piotroski-formula-yields-14-promising-investments
- https://www.investopedia.com/articles/fundamental-analysis/09/five-must-have-metrics-value-investors.asp
- https://www.fool.com/investing/2018/03/21/9-essential-metrics-all-smart-investors-should-kno.aspx
- https://medium.com/swlh/the-10-most-powerful-metrics-in-investing-with-cheat-sheet-f0d06378a97d