Matplotlib
Creating objects for interaction
-
Create empty plot to be filled in with data
import matplotlib.pyplot as plt
fig, ax = plt.subplots()
plt.show()
-
Create some plot
from sklearn import datasets
import pandas as pd
import numpy as np
iris = datasets.load_iris()
df = pd.DataFrame(data= np.c_[iris['data'], iris['target']],
                     columns= iris['feature_names'] + ['target'])
print(df.head())

import matplotlib.pyplot as plt
fig, ax = plt.subplots()
ax.plot(df.iloc[:,0], df.iloc[:,1])
plt.show()
sepal length (cm) sepal width (cm) petal length (cm) petal width (cm) \ 0 5.1 3.5 1.4 0.2 1 4.9 3.0 1.4 0.2 2 4.7 3.2 1.3 0.2 3 4.6 3.1 1.5 0.2 4 5.0 3.6 1.4 0.2 target 0 0.0 1 0.0 2 0.0 3 0.0 4 0.0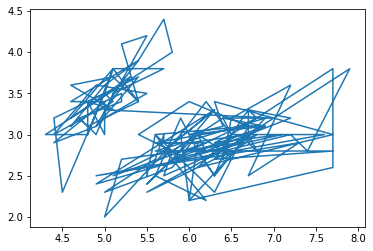
Other functionalities
-
plt.axis([x-axis_start, xend, ystart, yend])
-
plt.plot(x,y,‘color or dots or any fucking thing to represent the numbers’)
-
r– means red dashes and bs means blue squares and g^ means green triangles
-
make a numpy array using arange(start, end, step_size)
-
multiple plot in plot() plot(t, t, ‘r–’, t, t**2, ‘bs’, t, t**3, ‘g^’)
-
tuple unpacking with obj_name, comma is the essence
-
setting linewidth with: plt.plot(x,y,‘r–’, linewidth=1.0)
-
plt.setp(lines, color=‘r’, linewidth=2.0) when lines= plt.plot(x1,y1,x2,y2)
-
plt.plot(t1, f(t1), ‘bo’, t2, f(t2), ‘k’) and the use of subplot() command
-
plt.figure(fig_no)
-
using figures and subplot()
plt.figure(1)                # the first figure
plt.subplot(211)             # the first subplot in the first figure
plt.plot([1, 2, 3])
plt.subplot(212)             # the second subplot in the first figure
plt.plot([4, 5, 6])


plt.figure(2)                # a second figure
plt.plot([4, 5, 6])          # creates a subplot(111) by default

plt.figure(1)                # figure 1 current; subplot(212) still current
plt.subplot(211)             # make subplot(211) in figure1 current
plt.title('Easy as 1, 2, 3')
-
text(x, y, r’what to show in regex format’)
-
xlabel, ylabel, title, axis- already studied, grid(True | False)
-
plt.xlabel(’text’, fontsize= 14 , color= ‘red’)
-
to write sigma sign TeX expression needs to be used and can be done as
plt.title(r’\(\sigma_i=15\)’)
starting with dollar in regex
-
similar for pi, mu etc.
Additional
import matplotlib.pyplot as plt
plt.scatter(x,y)
plt.title("Web traffic over the last month")
plt.xlabel("Time")
plt.ylabel("Hits/hour")
plt.xticks([w*7*24 for w in range(10)],
['week %i'%w for w in range(10)])
plt.autoscale(tight=True)
plt.grid()
plt.show()
-
sp.polyfit(x, y, d)
-
sp.poly1d(polyfitted fn)
-
error function error(poly1d,x,y) and ((f(x)-y)**2)) is the error
-
matplot’s different plots legends for different plots
-
sp.optimize.fsolve()
-
polynomial fitting not better to solve a fitting problem and these make a lot of error in the process.
-
during polyfit several data can be extracted like residue , and so on.